Themes > Features
28.07..2008
New Light on Business Services
Despite
its relatively low level of per capita income by developed country standards,
India’s growth during much of the post-liberalization period has been
led by services. There are plausible reasons why growth in developing
countries today could reflect a premature expansion of services. Manufacturing
units in the contemporary world rely as much or more on management and
control as on technology to raise productivity and reduce costs. This
has increased the services component in manufacturing costs. The pressure
to reduce costs leads to the outsourcing of many of these functions, so
that services that were earlier counted as internal costs of a manufacturing
firm are now externalized, resulting in an increase in services GDP. Inasmuch
as liberalization leads to a faster adoption of best practice technologies
from the developed countries in developing countries, the latter too tend
to reflect this tendency.
Technological changes also contribute to an expansion of services. For example, the communications revolution has cheapened the cost of communication services, resulting in much greater use of such services by a wider section of the population. Finally, the inevitable role of government in accelerating growth and providing a range of public services tends to increase the shares of education, health and public administration (not to mention defence) in GDP.
However, even these factors cannot explain the fact that GDP in services exceeds 50 per cent of the total at India’s level of per capita income. Services must be growing faster than is warranted by the factors that are common to all countries. This is partly happening because technological changes and developments have made a number of services exportable through various modes of supply, including cross-border supply through digital transmission. Thus, in the case of IT and IT-enabled services in India, the expansion of output is driven by the expansion of exports, with positive balance of payments implications. This supports the presumption that services-based growth is a new (dynamic) trajectory of development in which modern, knowledge-intensive services play a role.
In India, this view is buttressed by the fact that among services, the most “visible” segments are the so-called knowledge-intensive services, consisting principally of software, business, financial and communication services. There are several significant differences between these four sectors. One crucial difference is that while software and, to a lesser extent, business services are important exports generating foreign exchange revenues, financial and communication services are dominantly directed at the domestic market. According to the Reserve Bank of India’s balance of payments data, gross foreign exchange revenues from these four sectors rose from $24.7billion in 2004-05 to $62.4 billion in 2007-08, or at a compound rate of more than 40 per cent. However, throughout this period software and business services accounted for more than 90 per cent of these revenues.
Inasmuch as exports are an important inducement to invest, this evidence could be taken to imply that among the modern, market-oriented, knowledge intensive services, software and business services are important drivers of growth. The increases in income generated in these and other sectors create the demand for the expansion of other knowledge-intensive services such as communications and financial services as well as “non-market oriented”, knowledge-intensive services such as education and health. That is, growth in services to an extent feeds on itself making this sector, it is argued, a powerful engine of growth.

While conceptually this argument is convincing, its importance as an explanation for growth is in the final analysis an empirical issue. Unfortunately, while data on the role of modern services in exports is easy to find in India, isolating the contribution of modern, knowledge intensive services and unorganized services of various kinds to GDP is more difficult. The claim has been that the contribution of these modern, market-oriented, knowledge services to GDP and employment has been significant. For example, NASSCOM claims that as a proportion of national GDP, the Indian information technology sector’s revenue, which is dominated by services, has grown from 1.2 per cent in financial year 1997-98 to 5.5 per cent in 2007-08. However, besides the fact that these are gross revenues and not value-added figures, there are all sorts of doubts that have been cast on these numbers (See Macroscan, Business Line, March 11, 2008).
Based on these figures of Global Insight, the recently released biennial report on Science and Engineering Indicators 2008 brought out by the NSF concludes that: “Market-oriented knowledge-intensive services—business, financial, and communications—are driving growth in the service sector, which now accounts for nearly 70% of global economic activity. Market-oriented knowledge-intensive services generated $12 trillion in gross revenues (sales) in 2005 and grew almost twice as fast as other services between 1986 and 2005.” This suggests that if these sectors are important in India’s GDP and exports, the opportunities for future growth are substantial.
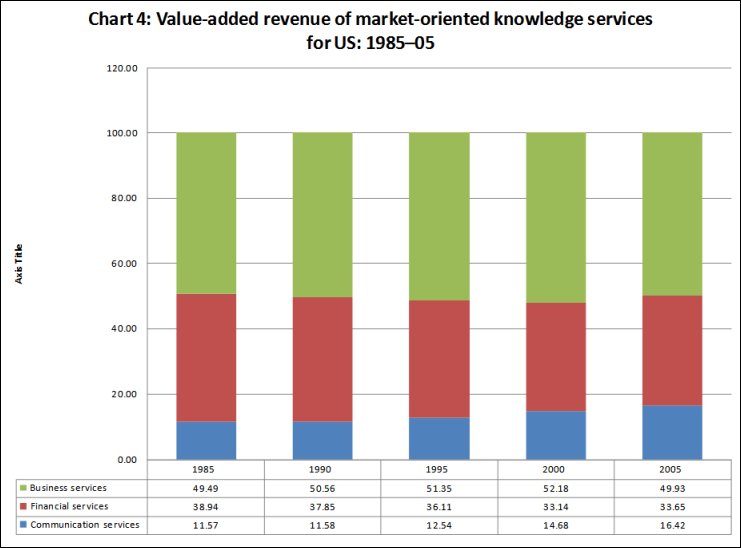
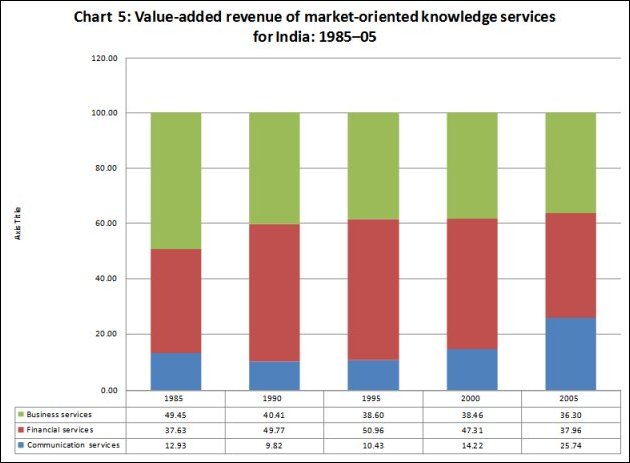
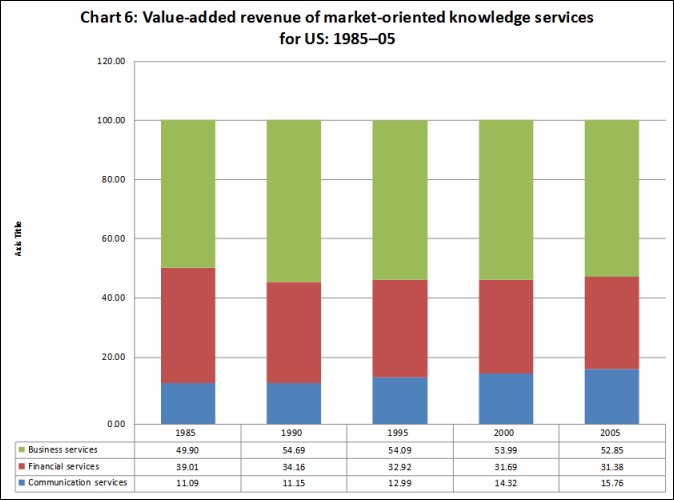
Turning to the data on India, what is noteworthy is that over the 10 years between 1985 and 1995, the share of commercial or “market-oriented” services in total value added revenue in knowledge-intensive services increased from 47 per cent to 64 per cent (Chart 1). In the subsequent 10 years it has risen further to 67 per cent. This compares well with the 69 per cent level at which it stood globally and in the United Sates in 2005, and the average levels of above 60 per cent in the world and the US throughout the 20 year period 1985-2005 (Charts 2 and 3).
But how important are market-oriented knowledge services, (which consist of Communications, Financial and Business Services according to the NSF) in the Indian economy? The ratio of value added revenues from these services to GDP, in 2000 constant price dollars, rose from 5.30 per cent in 1985 to 8.64 in 1995 and 11.96 per cent in 2005. This does point to a significant role for these services in the national economy, especially when compared with the corresponding values for ‘non-market oriented’, knowledge-intensive services (consisting of education and health services). Those values were 5.97, 4.81 and 5.72 per cent.
However, as noted earlier, the driver for export-led growth in India is the business services sector which includes both software services and IT-enabled services. It is the growth of this segment which is seen as partly providing the stimulus for expansion of financial and communications services. The contribution of business services to GDP is much smaller, having risen from 2.6 to 3.3 per cent of GDP between 1985 and 1995, and then to 4.3 per cent in 2005.
Further, the NSF figures suggest that the knowledge-intensive services sectors together accounted for 17.7 per cent of GDP. Adding on the 8 per cent contributed by railways and public administration and defence (as per the official National Accounts Statistics), the total comes to 25.7 per cent. That leaves almost half of the services sector unaccounted for, which presumably would consist substantially of unorganized services. This makes the argument that services are reflective of a new dynamism in India that much less convincing.
Technological changes also contribute to an expansion of services. For example, the communications revolution has cheapened the cost of communication services, resulting in much greater use of such services by a wider section of the population. Finally, the inevitable role of government in accelerating growth and providing a range of public services tends to increase the shares of education, health and public administration (not to mention defence) in GDP.
However, even these factors cannot explain the fact that GDP in services exceeds 50 per cent of the total at India’s level of per capita income. Services must be growing faster than is warranted by the factors that are common to all countries. This is partly happening because technological changes and developments have made a number of services exportable through various modes of supply, including cross-border supply through digital transmission. Thus, in the case of IT and IT-enabled services in India, the expansion of output is driven by the expansion of exports, with positive balance of payments implications. This supports the presumption that services-based growth is a new (dynamic) trajectory of development in which modern, knowledge-intensive services play a role.
In India, this view is buttressed by the fact that among services, the most “visible” segments are the so-called knowledge-intensive services, consisting principally of software, business, financial and communication services. There are several significant differences between these four sectors. One crucial difference is that while software and, to a lesser extent, business services are important exports generating foreign exchange revenues, financial and communication services are dominantly directed at the domestic market. According to the Reserve Bank of India’s balance of payments data, gross foreign exchange revenues from these four sectors rose from $24.7billion in 2004-05 to $62.4 billion in 2007-08, or at a compound rate of more than 40 per cent. However, throughout this period software and business services accounted for more than 90 per cent of these revenues.
Inasmuch as exports are an important inducement to invest, this evidence could be taken to imply that among the modern, market-oriented, knowledge intensive services, software and business services are important drivers of growth. The increases in income generated in these and other sectors create the demand for the expansion of other knowledge-intensive services such as communications and financial services as well as “non-market oriented”, knowledge-intensive services such as education and health. That is, growth in services to an extent feeds on itself making this sector, it is argued, a powerful engine of growth.

While conceptually this argument is convincing, its importance as an explanation for growth is in the final analysis an empirical issue. Unfortunately, while data on the role of modern services in exports is easy to find in India, isolating the contribution of modern, knowledge intensive services and unorganized services of various kinds to GDP is more difficult. The claim has been that the contribution of these modern, market-oriented, knowledge services to GDP and employment has been significant. For example, NASSCOM claims that as a proportion of national GDP, the Indian information technology sector’s revenue, which is dominated by services, has grown from 1.2 per cent in financial year 1997-98 to 5.5 per cent in 2007-08. However, besides the fact that these are gross revenues and not value-added figures, there are all sorts of doubts that have been cast on these numbers (See Macroscan, Business Line, March 11, 2008).

Based on these figures of Global Insight, the recently released biennial report on Science and Engineering Indicators 2008 brought out by the NSF concludes that: “Market-oriented knowledge-intensive services—business, financial, and communications—are driving growth in the service sector, which now accounts for nearly 70% of global economic activity. Market-oriented knowledge-intensive services generated $12 trillion in gross revenues (sales) in 2005 and grew almost twice as fast as other services between 1986 and 2005.” This suggests that if these sectors are important in India’s GDP and exports, the opportunities for future growth are substantial.
Turning to the data on India, what is noteworthy is that over the 10 years between 1985 and 1995, the share of commercial or “market-oriented” services in total value added revenue in knowledge-intensive services increased from 47 per cent to 64 per cent (Chart 1). In the subsequent 10 years it has risen further to 67 per cent. This compares well with the 69 per cent level at which it stood globally and in the United Sates in 2005, and the average levels of above 60 per cent in the world and the US throughout the 20 year period 1985-2005 (Charts 2 and 3).

But how important are market-oriented knowledge services, (which consist of Communications, Financial and Business Services according to the NSF) in the Indian economy? The ratio of value added revenues from these services to GDP, in 2000 constant price dollars, rose from 5.30 per cent in 1985 to 8.64 in 1995 and 11.96 per cent in 2005. This does point to a significant role for these services in the national economy, especially when compared with the corresponding values for ‘non-market oriented’, knowledge-intensive services (consisting of education and health services). Those values were 5.97, 4.81 and 5.72 per cent.
However, as noted earlier, the driver for export-led growth in India is the business services sector which includes both software services and IT-enabled services. It is the growth of this segment which is seen as partly providing the stimulus for expansion of financial and communications services. The contribution of business services to GDP is much smaller, having risen from 2.6 to 3.3 per cent of GDP between 1985 and 1995, and then to 4.3 per cent in 2005.

Further, the NSF figures suggest that the knowledge-intensive services sectors together accounted for 17.7 per cent of GDP. Adding on the 8 per cent contributed by railways and public administration and defence (as per the official National Accounts Statistics), the total comes to 25.7 per cent. That leaves almost half of the services sector unaccounted for, which presumably would consist substantially of unorganized services. This makes the argument that services are reflective of a new dynamism in India that much less convincing.


Table
1: Value
- Added Revenue of Knowledge - Intensive Services :
1985-05 |
|||||
| 1985 | 1990 | 1995 | 2000 | 2005 | |
|
All Market - Oriented Knowledge - Intensive Services |
|||||
|
All Regions/ Countries |
100.0 |
100.0 | 100.0 | 100.0 | 100.0 |
|
Unites States |
47.2 |
44.4 | 41.2 | 41.7 | 40.3 |
|
EU |
25.1 |
26.1 | 26.0 | 25.4 | 24.7 |
|
Asia |
14.8 |
17.5 | 19.9 | 20.4 | 22.2 |
|
China |
1.1 |
1.5 | 2.2 | 3.1 | 4.9 |
|
India |
0.4 |
0.5 | 0.7 | 0.9 | 1.1 |
|
Communication Services |
|||||
|
All Regions/ Countries |
100.0 |
100.0 | 100.0 | 100.0 | 100.0 |
|
Unites States |
45.2 |
42.7 | 42.7 | 40.7 | 38.7 |
|
EU |
23.0 |
23.6 | 23.2 | 23.1 | 22.2 |
|
Asia |
11.3 |
12.5 | 14.5 | 19.2 | 22.6 |
|
China |
0.6 |
0.9 | 2.3 | 4.2 | 7.2 |
|
India |
0.4 |
0.4 | 0.6 | 0.9 | 1.8 |
|
Financial Services |
|||||
|
All Regions/ Countries |
100.0 |
100.0 | 100.0 | 100.0 | 100.0 |
|
Unites States |
47.3 |
40.1 | 37.6 | 39.9 | 37.6 |
|
EU |
25.3 |
24.6 | 23.3 | 20.2 | 19.0 |
|
Asia |
15.3 |
23.8 | 26.5 | 27.2 | 29.9 |
|
China |
1.9 |
3.0 | 3.9 | 5.7 | 8.4 |
|
India |
0.4 |
0.7 | 1.0 | 1.3 | 1.3 |
|
Business Services |
|||||
|
All Regions/ Countries |
100.0 |
100.0 | 100.0 | 100.0 | 100.0 |
|
Unites States |
47.6 |
48.0 | 43.4 | 43.1 | 42.6 |
|
EU |
25.4 |
27.7 | 28.5 | 29.3 | 29.3 |
|
Asia |
15.3 |
14.0 | 16.7 | 16.4 | 16.9 |
|
China |
0.7 | 0.6 | 0.9 | 1.1 | 1.7 |
|
India |
0.4 |
0.4 | 0.5 | 0.7 | 0.8 |
©
MACROSCAN 2008